Smart Thermostat Energy Reports: Turn Data Into Savings
By Priya Nandakumar • 19th Feb
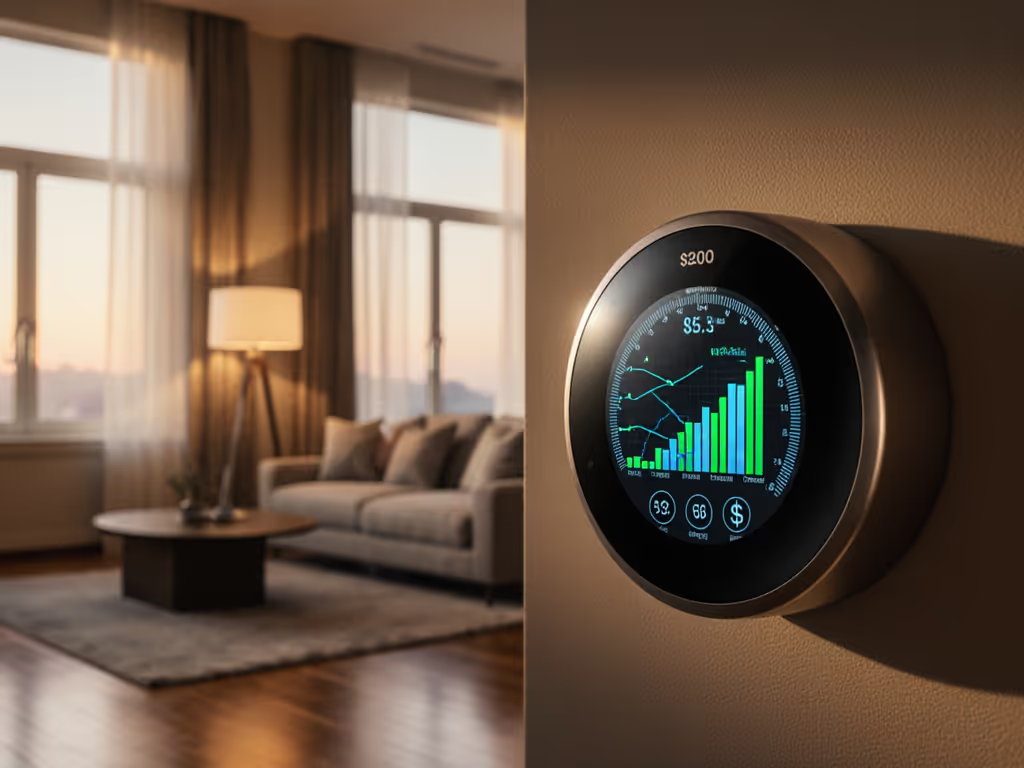
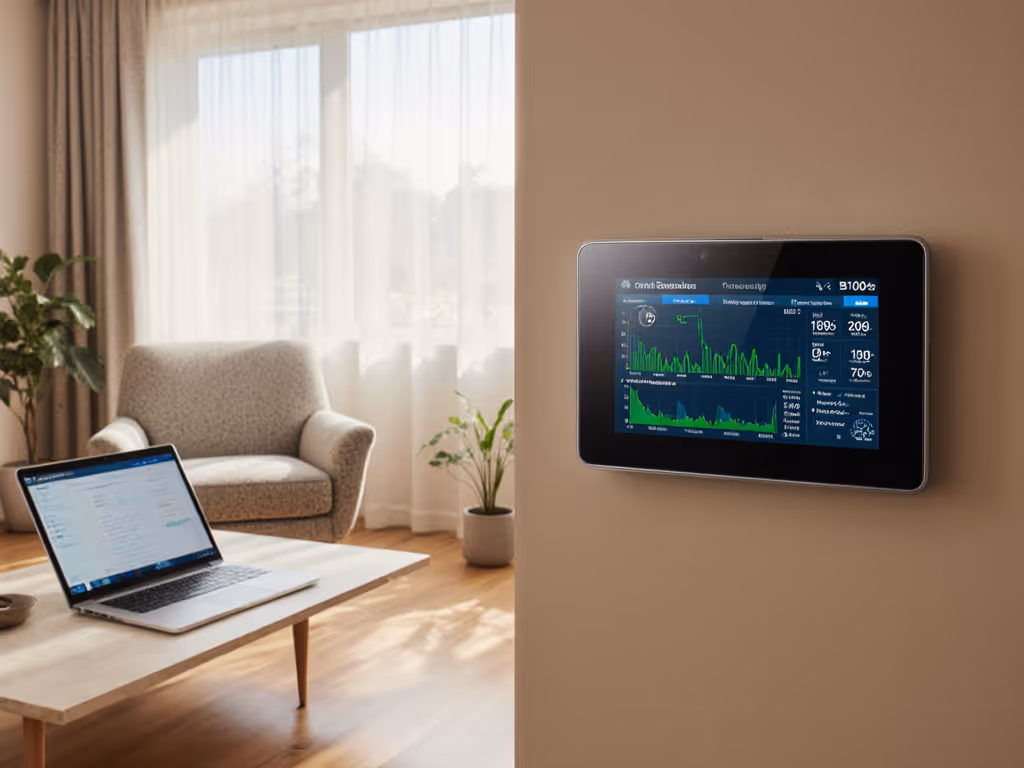
Smart thermostat energy reports and energy consumption analytics transform raw usage data into actionable insights that help you identify where your heating and cooling dollars actually go, then reclaim them. But reading these reports correctly means understanding what the numbers mean for your specific system, not just chasing vanity metrics. This guide walks you through the most common questions homeowners ask when they first see their thermostat's analytics dashboard. For a step-by-step primer on reading charts and metrics, see our guide to interpreting energy reports.
What Exactly Am I Looking at in an Energy Report?
When you open your smart thermostat's app or web portal, you'll typically see breakdowns of heating and cooling runtime, often measured in hours per day or per week, paired with an estimated energy cost or carbon footprint. These aren't guesses; they are calculated from your system's documented runtime and your utility rate (if you enter it).
The core metric is runtime, not temperature setpoint. Your thermostat logs every minute the heating or cooling call is active, regardless of outdoor conditions or equipment stage. A report might show "heating ran 6 hours yesterday" or "cooling consumed 8.2 kWh last week." Some platforms also show peak consumption windows (when your system works hardest), which correlates to time-of-use rates if your utility offers them.
The data is only as reliable as the compatibility between the thermostat's wiring and your HVAC equipment. I once saw a homeowner with a dual-fuel setup who'd tied the W2 (auxiliary heat) terminal into the AUX port on their thermostat after a 'smart' upgrade, short-cycling the furnace constantly and inflating heating runtime by 40%. We photographed the control board, labeled every conductor, and corrected it with a proper jumper and outdoor sensor logic. The report normalized immediately, proving that compatibility and safety come before features, and data integrity depends on correct wiring first.
How Much Can I Actually Save with These Reports?
Industry data shows meaningful but context dependent savings. According to ENERGY STAR, homeowners who act on smart thermostat energy reports typically see reductions of 8% on heating and cooling bills, or roughly $50 per year. Broader studies report savings between 10% and 20%, translating to $120-$150 annually for many households.
However, these figures assume three things:
-
You understand your baseline. Before installing a smart thermostat, you need to know your typical monthly heating and cooling cost from past utility bills. Without that anchor, reported savings feel abstract.
-
You actually adjust behavior based on the report. Smart thermostats automate setback schedules, but reports only drive savings if you act on the insights (say, lowering the heating setpoint by 2 degrees overnight or adjusting cooling during peak-rate hours).
-
Your equipment is compatible and wired correctly. If your thermostat doesn't properly communicate with your furnace's stage controls, heat pump reversing valve, or auxiliary heating logic, the reported savings won't materialize, and you risk short-cycling or comfort loss.
Kill the breaker first, label wires before you touch anything, and verify compatibility with your exact HVAC type (furnace + AC, heat pump, dual-fuel, or boiler). Data-driven savings start with a safe, correct install. Not sure whether to DIY or hire a pro? Our DIY vs pro wiring guide breaks down cost, complexity, and safety trade-offs.
What Do Energy Usage Patterns Tell Me About My System?
Energy usage patterns are the fingerprint of your home's comfort behavior. When your thermostat records runtime over weeks or months, patterns emerge:
- Daily rhythm: Heating peaks in early morning; cooling peaks in late afternoon. This tells you when outdoor temperature swings hit your home hardest.
- Weekly variation: Weekday versus weekend usage reveals the impact of occupancy and manual adjustments.
- Seasonal trends: Comparing January to February or June to July shows equipment efficiency as conditions change, and spots when servicing may be needed.
These patterns are also where compatibility problems surface. If heating runtime suddenly doubles while outdoor temperature drops only 10%, your thermostat may be misconfigured for your system's staging (for example, calling auxiliary heat too aggressively on a heat pump or not cycling the compressor correctly between stages on a multi-stage furnace).
Reading your report means asking: Is this pattern normal for my equipment and climate, or is something wired or configured wrong? Most thermostat apps don't answer that directly; you may need a technician to review the board and wiring diagram.
How Do I Use Thermostat Analytics to Identify Waste?
Waste shows up as runtime spikes that don't correlate to outdoor temperature changes. For instance:
- Heating runs at full load when outdoor temp is 45°F. On a heat pump with proper outdoor sensor and staging logic, this shouldn't happen; the system should use minimal auxiliary heat or none at all. Misconfigured O/B (reversing valve) polarity or missing outdoor sensor logic is often the culprit.
- Cooling runs 2 hours overnight despite setback to 76°F. Room-to-room temperature imbalance, a stuck damper in a zoned system, or a thermostat placed near a heat source (lamp, window, kitchen) can trigger unnecessary cycles.
- Fan runtime is high but temperature stays constant. Your thermostat may be set to "fan on" instead of "fan auto," wasting energy without benefit.
Once you spot waste, your next moves depend on the root cause. Some are simple (change fan mode, adjust setpoint). Others require wiring review or professional recalibration. Don't guess. Photograph the thermostat and control board, then consult your system's manual or a qualified technician. Compatibility and safety come before guessing.
Can Energy Reports Help Me Enroll in Utility Rebates or Demand Response?
Yes, but indirectly. Energy reports prove consumption trends and establish your pre-smart-thermostat baseline, which many utility rebate programs require. If your provider offers a rebate for upgrading to an ENERGY STAR certified model, they may ask for proof of your current heating/cooling cost (data you can pull from past bills and early smart thermostat reports).
Demand response (DR) programs ask your thermostat to adjust setpoints during peak-rate windows or grid stress events. Your energy report will show the impact: runtime reduction during the event window, and total energy and cost savings over the month. But this is critical: your thermostat must be compatible with your utility's DR protocol (usually OpenADR or a proprietary integration). Check with your provider before purchasing, not after. To find eligible models and claim steps, use our utility rebate guide. No rebate or program credit is worth an install that doesn't work.
What Role Does Remote Access Play in Reducing Energy Waste?
Remote control via smartphone or computer lets you avoid heating or cooling an empty home, a high-value use case that analytics often underestimate. Geofencing (location-based setback) automates this, but manual override matters too. Get more from it with our geofencing optimization guide. If you leave work early or return late, you can adjust your thermostat remotely rather than letting it follow a rigid schedule.
Reports should show the impact of geofencing or vacation modes: reduced runtime on days you were away longer than expected. Compare weeks with active geofencing to weeks when you relied on fixed schedules, and you'll often see a 5-10% runtime reduction, worth $60-$150 per year depending on your climate.
Again, this only works if the thermostat's wiring and configuration align with your HVAC setup. Remote access to a misconfigured system just means remote waste.
How Do I Interpret Conflicting Data from My App versus My Utility Bill?
Thermostats estimate energy cost based on runtime and a utility rate you provide; actual utility bills include baseload consumption (hot water, appliances, lighting). If your thermostat reports $25 in heating cost but your bill increased $80, the difference is your home's total energy draw.
To isolate HVAC impact, subtract your off-season (summer or winter) utility cost from your peak-season bill, then compare that delta to your thermostat's reported savings. If the delta doesn't improve after installing the smart thermostat, the device may not be optimizing your system correctly (once again, a wiring or configuration problem to investigate).
Summary and Final Verdict
Smart thermostat energy reports and energy consumption analytics are only useful if three conditions are met: correct wiring and compatibility with your equipment, transparent understanding of your baseline consumption, and your willingness to act on the insights. Alone, the app's sleek graphs don't save money. The discipline to read patterns, identify waste, and adjust your behavior (backed by a thermostat that safely, accurately communicates with your furnace, heat pump, or dual-fuel system) does.
Start by reviewing your current utility bill and HVAC equipment documentation. Then, when you install a smart thermostat, kill the breaker first, label wires before you touch anything, and ensure the wiring matches your equipment's control board schematic. Only then will your energy reports tell the truth. From there, check your analytics monthly, spot the patterns that matter in your climate, and adjust setpoints or schedules incrementally. Over a year or two, $120 to $150 in annual savings will feel both real and earned, not a promise, but a result of understanding what the data actually means for your home.
Related Articles