Understanding Smart Thermostat Energy Reports
By Priya Nandakumar • 3rd Oct
As a former HVAC technician who's seen countless homeowners struggle with mismatched equipment, I know that understanding thermostat energy reports starts with verifying compatibility, not chasing flashy features. Your smart thermostat collects valuable data, but raw numbers mean nothing if they don't align with your specific HVAC configuration. Power off at the breaker; label wires before you touch anything. When analytics conflict with your wiring diagram, trust the terminals every time. Match features to terminals, not to aesthetics.
Why Energy Reports Matter for Your Specific System
Many homeowners install smart thermostats hoping for instant savings, only to discover their equipment can't support the algorithms. I once arrived at a service call where a homeowner had tied W2 into AUX on their dual-fuel system after a 'smart' upgrade, causing constant furnace short-cycling. Their energy report showed excessive runtime, but they misinterpreted it as a failing thermostat rather than a wiring incompatibility.
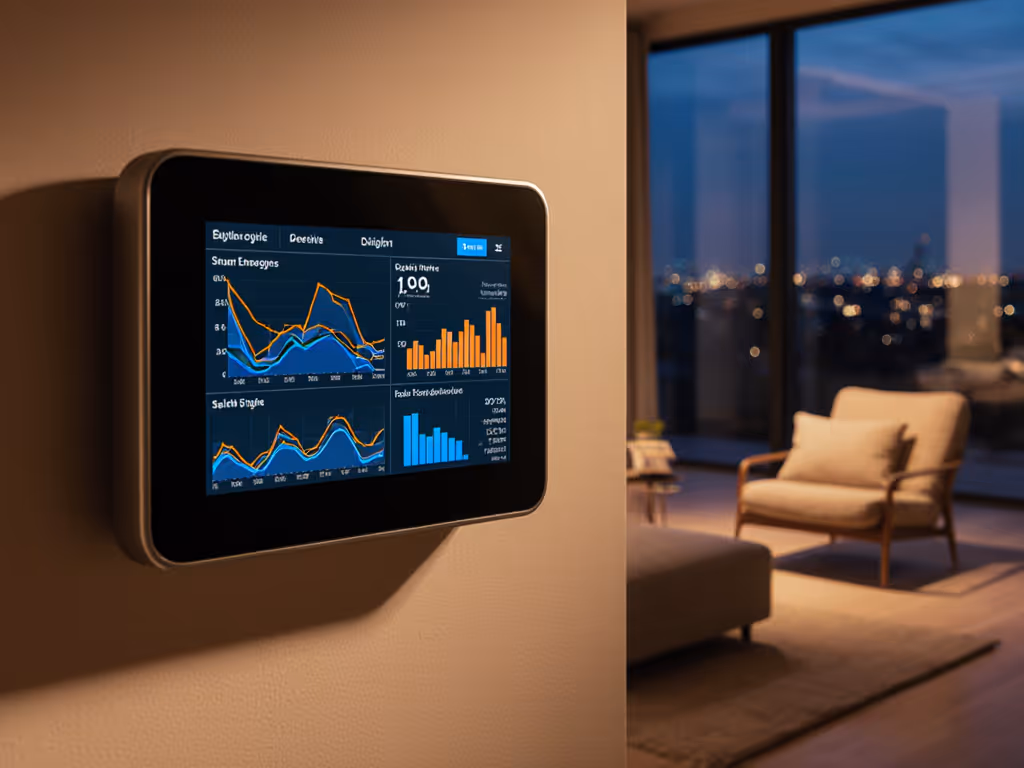
What Energy Reports Actually Measure
Your thermostat tracks four critical data streams:
- Heating/cooling cycle frequency (how often Y, W, or O/B terminals activate)
- Runtime duration per cycle (time between G fan calls and stage completions)
- Temperature delta achievement (how quickly R to C voltage delivers setpoint changes)
- Auxiliary heat usage (W2 or AUX terminal engagement on heat pumps)
"Raw numbers mean nothing if they don't align with your specific HVAC configuration."
If your report shows frequent auxiliary heat activation during mild weather, it may indicate incorrect O/B valve polarity or missing outdoor temperature sensor integration, not a thermostat defect.
Decoding Your Specific HVAC System's Energy Report
Heat Pump vs. Dual-Fuel Systems
Heat pump owners should watch these key metrics:
- Compressor lockout temperatures (when AUX activates)
- Defrost cycle frequency
- Reversing valve transitions (O/B terminal switching)
Dual-fuel system owners must verify:
- Furnace crossover temperature settings
- Heat pump runtime before fossil fuel backup engages
- W2 and AUX terminal usage differentiation
A well-configured system should show less than 15% auxiliary heat usage during transitional seasons. Higher percentages indicate wiring or configuration issues, not thermostat failure.
Critical Risk Flags in Energy Data
Before acting on any report, check these compatibility warnings:
- Short-cycling alerts: More than 12 cycles/hour indicate wiring errors or mismatched staging logic
- Temperature overshoot: >2°F deviation from setpoint suggests incorrect heat anticipation settings
- Continuous fan runtime: G terminal remaining active more than 30 minutes after a heating or cooling cycle indicates improper fan delay settings

These aren't just inefficiency markers. They are early warnings of potential control board damage from electrical feedback.
How to Interpret Energy Savings Data Accurately
Most homeowners make these three critical mistakes when reviewing reports:
- Comparing apples to oranges: Using generic "savings" percentages without accounting for your specific HVAC type
- Ignoring staging logic: Not verifying if multi-stage systems (Y2, W2) are activating properly
- Misreading time-of-use data: Applying TOU strategies to equipment lacking compressor protection delays
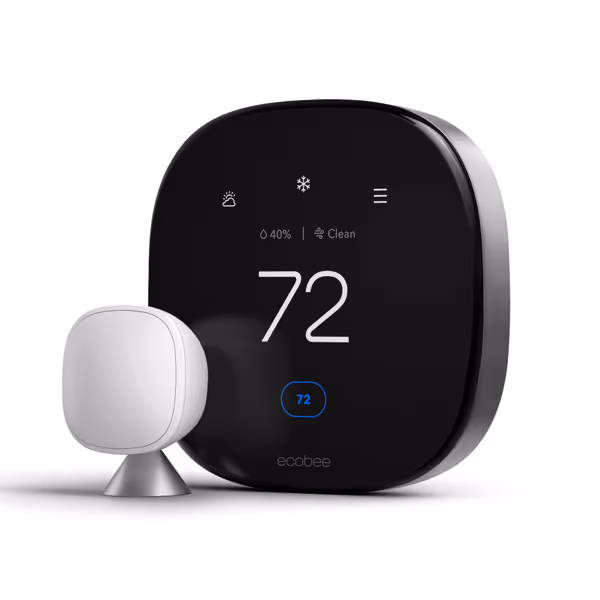
ecobee Smart Thermostat Premium
Smart home hub for comfort, savings, and air quality.
$259.99
HVAC CompatibilityMost 24VAC systems (furnace, AC, heat pump, boiler, PTAC)
HVAC CompatibilityMost 24VAC systems (furnace, AC, heat pump, boiler, PTAC)
Pros
Save up to 26% on energy yearly with SmartSensor included.
Integrated air quality monitor and filter change reminders.
Works with Siri, Alexa, Google Assistant; includes smart speaker.
Cons
Some advanced features require ecobee Smart Security subscription.
Customers find the thermostat easy to install with simple wiring and appreciate its temperature control features, particularly its programmable capabilities. The device integrates well with smart home systems, including Apple HomeKit and Alexa, and customers find it intuitive to use, with vacation settings being easy to set up. The accuracy and temperature adjustment features receive mixed feedback - while some customers report accurate temperature readings, others mention the display is off by about 2 degrees, and some report issues with temperature control.
Customers find the thermostat easy to install with simple wiring and appreciate its temperature control features, particularly its programmable capabilities. The device integrates well with smart home systems, including Apple HomeKit and Alexa, and customers find it intuitive to use, with vacation settings being easy to set up. The accuracy and temperature adjustment features receive mixed feedback - while some customers report accurate temperature readings, others mention the display is off by about 2 degrees, and some report issues with temperature control.
For example, ecobee's Home Energy Reports show heat pump runtime versus auxiliary heat usage, but if your AUX terminal connects to emergency heat instead of properly staged backup, the data becomes misleading. Always cross-reference report metrics with your wiring diagram.
Making Sense of Thermostat Analytics for Real Savings
Step-by-Step Data Verification
-
Confirm your system type matches thermostat specifications (heat pump vs dual-fuel vs conventional)
-
Check terminal mapping against manufacturer wiring diagrams, and don't assume W2 means the same thing across brands
-
Validate staging logic by comparing report data to expected cycle times
- Single-stage: 10-15 minute cycles
- Two-stage: Initial low-stage (5-7 min), then high-stage as needed
- Modulating: Gradual ramp-up/down with no distinct stages
-
Correlate weather data with energy consumption. Sudden spikes during mild weather indicate equipment issues.
Actionable Adjustments Based on Your Reports
| Report Metric | Actionable Adjustment | Safety Check |
|---|---|---|
| High AUX usage | Lower crossover temperature | Verify AUX terminal connects to backup heat, not emergency |
| Frequent short cycles | Increase minimum off time | Confirm no wiring shorts between R-C terminals |
| High fan runtime | Adjust post-purge settings | Check G terminal wiring to air handler |

Critical Questions Homeowners Should Ask
"Why does my energy report show high usage even when set to 'Eco' mode?"
This typically indicates your smart thermostat's adaptive recovery feature is overcompensating. For heat pumps, verify:
- Is O/B terminal wired correctly (50% of 'reverse cycle' issues come from this single terminal)?
- Is outdoor temperature sensor properly installed and communicating?
- Does your system have sufficient staging (Y2, W2) for gradual temperature adjustments?
"How do I know if my energy savings claims are accurate?"
Utility-grade verification requires:
- Baseline data from identical weather periods
- Verification your thermostat isn't sacrificing comfort for "savings"
- Confirmation equipment isn't short-cycling to hit setpoints faster
Most smart thermostats calculate savings by comparing current runtime to theoretical "always-on" scenarios, not your actual previous usage. For true energy consumption tracking, you need whole-home energy monitoring.
"What should I do when reports conflict with my comfort experience?"
When thermostat analytics reveal inconsistencies:
- Check thermostat placement (away from vents, sunlight, electronics)
- Verify remote sensors are properly positioned (not near heat sources)
- Confirm no wiring issues causing false readings (loose Y or W connections)
Remember: Your HVAC system's physical constraints always override software promises. A Nest thermostat can't magically make a single-stage furnace behave like a modulating heat pump.
Your Actionable Next Step
Don't blindly accept your thermostat's energy reports as gospel. This week, take these three verification steps:
- Photograph your control board terminals with wires labeled (R, C, Y, G, O/B, AUX, W2)
- Run your system through complete heating and cooling cycles while monitoring actual runtime
- Compare report data against manufacturer specifications for your exact HVAC model
When analytics and wiring diagrams tell different stories, your wiring diagram wins every time. Match features to terminals, not to promises. Understanding thermostat energy reports isn't about chasing percentage savings, it's about verifying your entire system works as designed, without risking control boards or comfort. Your equipment's longevity depends on respecting its physical limitations, not just interpreting data.
Related Articles